
Model Interpretation using KernelSHAP for weather prediction regressor
This notebook demonstrates the use of DIANNA with the SHAP Kernel explainer method for tabular data on the weather dataset.
Colab setup
[1]:
running_in_colab = 'google.colab' in str(get_ipython())
if running_in_colab:
  # install dianna
  !python3 -m pip install dianna[notebooks]

  # download data used in this demo
  import os
  base_url = 'https://raw.githubusercontent.com/dianna-ai/dianna/main/dianna/'
  paths_to_download = ['./models/sunshine_hours_regression_model.onnx']
  for path in paths_to_download:
      !wget {base_url + path} -P {os.path.dirname(path)}
0 - Libraries
[1]:
import dianna
import numpy as np
import pandas as pd
from sklearn.model_selection import train_test_split
from dianna.utils.onnx_runner import SimpleModelRunner

from numba.core.errors import NumbaDeprecationWarning
import warnings
# silence the Numba deprecation warnings in shap
warnings.simplefilter('ignore', category=NumbaDeprecationWarning)
1 - Loading the data
Load weather prediction dataset.
[2]:
data = pd.read_csv("https://zenodo.org/record/5071376/files/weather_prediction_dataset_light.csv?download=1")
Prepare the data
As the target, the sunshine hours for the next day in the data-set will be used. Therefore, we will remove the last data point as this has no target. A tabular regression model will be trained which does not require time-based data, therefore DATE and MONTH can be removed.
[3]:
X_data = data.drop(columns=['DATE', 'MONTH'])[:-1]
y_data = data.loc[1:]["BASEL_sunshine"]
Training, validation, and test data split.
[4]:
X_train, X_holdout, y_train, y_holdout = train_test_split(X_data, y_data, test_size=0.3, random_state=0)
X_val, X_test, y_val, y_test = train_test_split(X_holdout, y_holdout, test_size=0.5, random_state=0)
Get an instance to explain.
[5]:
# get an instance from test data
data_instance = X_test.iloc[10].to_numpy()
2 - Loading ONNX model
DIANNA supports ONNX models. Here we demonstrate the use of KernelSHAP explainer for tabular data with a pre-trained ONNX model, which is a MLP regressor for the weather dataset.
The model is trained following this notebook: https://github.com/dianna-ai/dianna-exploration/blob/main/example_data/model_generation/sunshine_prediction/generate_model.ipynb
[6]:
# load onnx model and check the prediction with it
model_path = '../../../dianna/models/sunshine_hours_regression_model.onnx'
loaded_model = SimpleModelRunner(model_path)
predictions = loaded_model(data_instance.reshape(1,-1).astype(np.float32))
predictions
[6]:
array([[3.0719438]], dtype=float32)
A runner function is created to prepare data for the ONNX inference session.
[7]:
import onnxruntime as ort

def run_model(data):
    # get ONNX predictions
    sess = ort.InferenceSession(model_path)
    input_name = sess.get_inputs()[0].name
    output_name = sess.get_outputs()[0].name

    onnx_input = {input_name: data.astype(np.float32)}
    pred_onnx = sess.run([output_name], onnx_input)[0]

    return pred_onnx
3 - Applying KernelSHAP with DIANNA
The simplest way to run DIANNA on image data is with dianna.explain_tabular.
DIANNA requires input in numpy format, so the input data is converted into a numpy array.
Note that the training data is also required since KernelSHAP needs it to generate proper perturbation.
[8]:
explanation = dianna.explain_tabular(run_model, input_tabular=data_instance, method='kernelshap',
                                     mode ='regression', training_data = X_train,
                                     training_data_kmeans = 5, feature_names=X_test.columns)
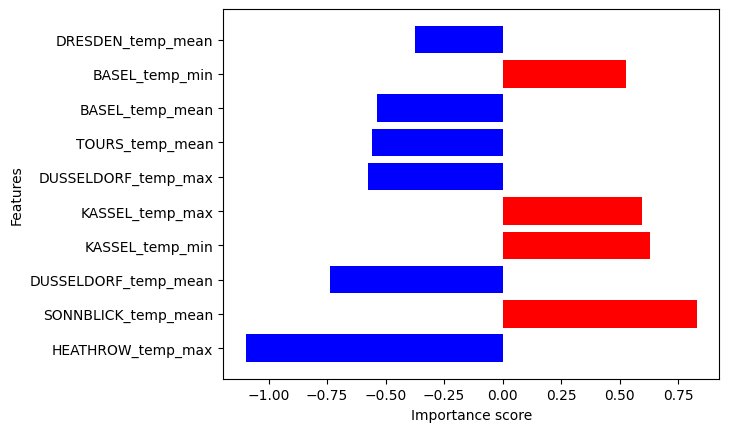
4 - Visualization
The output can be visualized with the DIANNA built-in visualization function. It shows the top 10 importance of each feature contributing to the prediction.
[9]:
from dianna.visualization import plot_tabular

fig, _ = plot_tabular(explanation, X_test.columns, num_features=10)
[ ]: